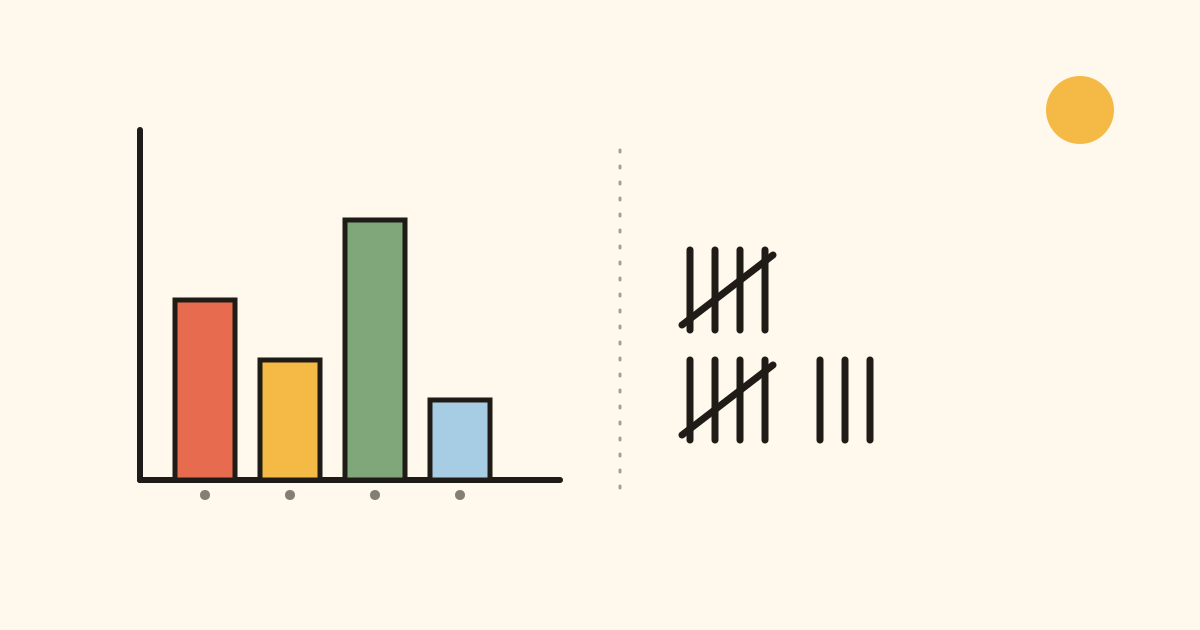
When parents think of primary-school math, arithmetic comes to mind first: addition, subtraction, times tables. But the curriculum has a fifth strand that's tested just as regularly and almost never shows up at home: data and chance. It covers reading bar charts, working out tally lists, and judging how likely something is.
The good news: this strand needs no new arithmetic. It needs a different skill — pulling the right answer out of a picture or a row of tally marks. And that's a skill you can build in everyday moments, no worksheet required.
Bar charts: axes first, then the bars
A bar chart shows quantities as bars of different heights. The most common beginner mistake is reading the bars straight away, without first checking what the axes stand for. So always ask first: "What's labelled along the bottom? And what does the height show?" For a chart of a class's favourite animals, the bottom might read "dog, cat, horse, rabbit, fish" — and the height shows how many children picked each one.
Only once those two questions are answered is it worth looking at individual bars: which is tallest? Which two together beat the tallest bar alone? These comparison questions are what actually gets tested — not simply reading off one number.
Tally lists: bundling in groups of five
A tally list counts with simple marks — but not as one long row of single strokes. They're bundled in groups of five: four vertical strokes, the fifth struck diagonally across them. That bundling isn't a formality — it's the actual point: a child who counts in fives instead of one by one ends up translating a tally straight into a multiplication fact — three full bundles of five plus two loose marks is 3 × 5 + 2, not seventeen recounted from scratch.
Practise this very concretely at home: count together how often the phone rings in a day, how many red cars pass on the way to school, or how often a die lands on six. Bundle after every fifth event — and the final number reads itself almost automatically.
Possible, certain, impossible
The third building block of this strand is the language of probability: possible, certain, impossible. That sounds trivial, but it's a genuine thinking task for primary schoolers, because they have to distinguish three levels where everyday speech usually only offers "maybe" and "no".
A good practice format is a dice game with questions mixed in: "Is it certain, impossible, or just possible that you roll a seven?" (impossible — the die has no seven), "That you roll an even number?" (possible), "That you roll a number between 1 and 6?" (certain). Questions like these slot easily into board-game night without ever feeling like a drill.
The most common mistake
The typical stumbling block on chart questions isn't computation — it's misreading: missing an axis label, picking the wrong bar, or counting a bundle of five as four strokes on a tally list. The check is always the same: say out loud what's being read — "this bar is cat, it shows six" — before doing anything with the number. Naming it out loud catches misreads far more reliably than a second calculation.
Data and chance looks, at first glance, like a side note next to times tables and crossing ten. In practice it's a skill used constantly outside school — from the weather forecast to the football table. A few minutes with charts and tally marks in daily life pays off twice over: on the next test, and in reading the world afterwards.